
Technical Analysis for Dummies (Part 1)
How to analyze stock charts and capitalize on trade opportunities
If you’re wondering what all those shapes, colors, and numbers are when you’re looking at a stock chart, you’re not alone. This post is for stock market beginners to learn how to read a price chart in order to understand when you should be buying and selling different stocks.
Technical analysis (TA) is the study of price action on stock charts, using historic prices to predict future price movements with a high probability.
Fundamental analysis (FA) is when you look at the financials of a company such as the income statement and balance sheet to determine if it’s overvalued or undervalued. We’ll focus more on this in future posts, but today is all about TA.
Most people I know who trade stocks just throw money at stocks on Robinhood and pray that they goes up. If you’re not doing at least some form of TA, you’re really just gambling. TA gives you the insight to understand where a stock might trade higher/lower so you know when to enter/exit a position. In short, it helps you make money.
The basics here are super important because it provides a solid foundation that we can build upon with more advanced techniques down the road.
Here’s what we’re going to cover:
Candlesticks, why you should use them, and time frames
Stock volume
Trading with support and resistance
Candlesticks
If you’re checking stock charts that look like this:
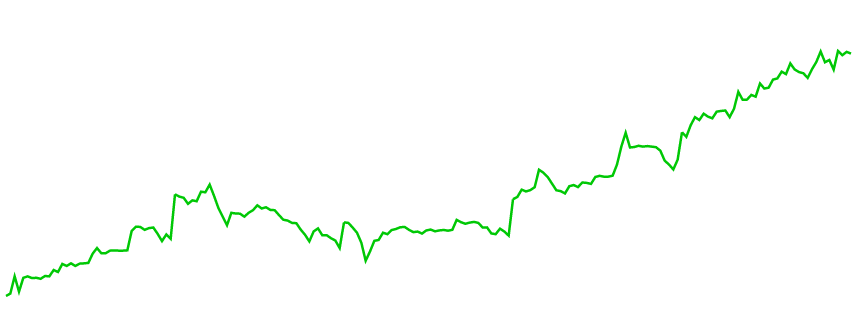
then this is for you.
Candlestick charts give you much more information about the stock price for a specific period of time, and without them you’re flying blind. Candlesticks form the building blocks to identify trends that help us identify when to buy and sell.
Here is the same chart but instead with candlesticks:
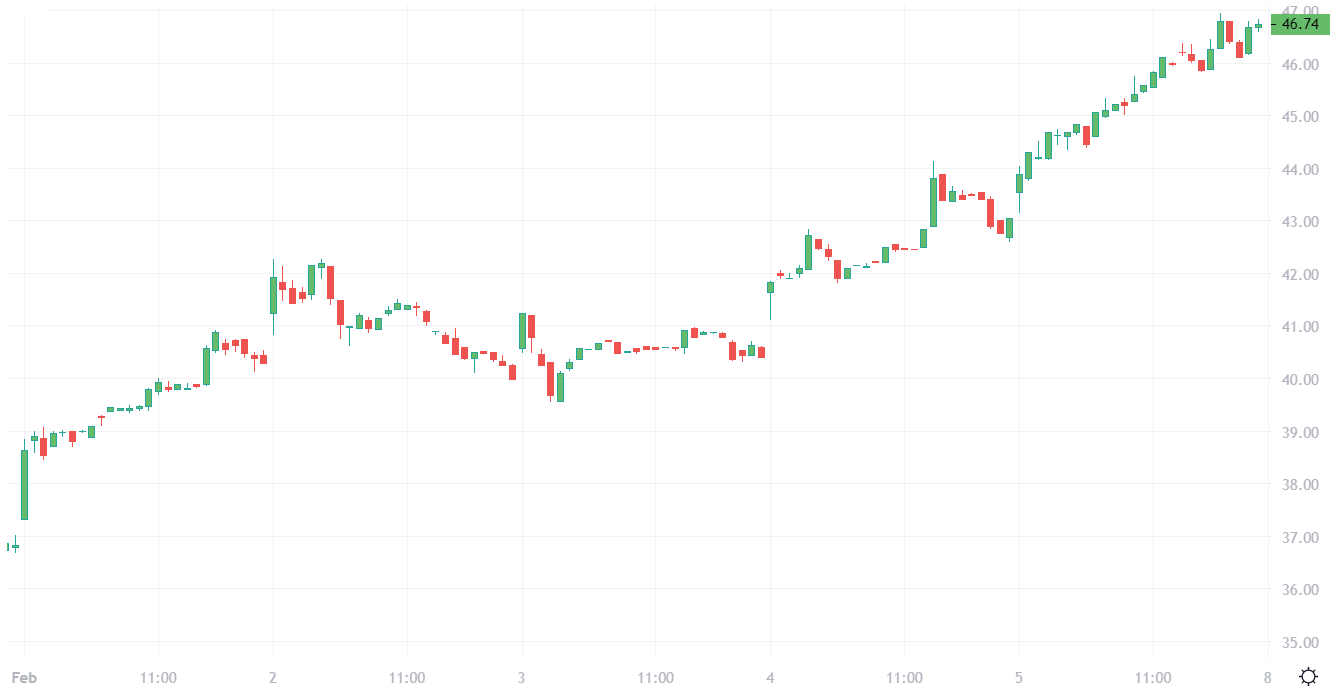
There’s a lot more going on here, huh? In trading/investing, information is money.
Each candlestick on the chart tracks the movement of the stock price over a specific period of time. The candlesticks above represent 15 minutes of price action over a 1-week period.
Green candles mean that the stock price closed higher than where it started after the 15 minute period, and red candles mean that the stock closed at a lower price than where it started.
Check out this diagram that notes the key features of a candlestick:

The “Open” is where the stock price trades at the beginning of the 15 minute candle, and the “Close” is where the stock price trades at the end of the 15 minutes. The spread in between these two prices forms the body of the candle. The “Wicks” show you the highest and lowest prices that the stock traded during the period.
With the click of a button on any stock-charting software (I use TradingView), you can adjust the timeframe for each candle. 15-minute candles were used for this example, but some of the other popular time frames are 1-hour, 4-hours, daily, and weekly.
What this means is that each candle will now represent the price during the time period that you selected (i.e. if you select daily candles, each candle will represent a whole day worth of price changes), so you can zoom out/in as necessary. I like to stick to either 4-hour or daily candles because those give a better indication of the overall direction of the stock, rather than getting caught up in the choppy price action in low time frames. Zoom out.
Volume
Volume refers to the amount of stock that is traded over a given time period. It’s crucial to keep an eye on volume because volume is ultimately what moves stock prices. If there are lot of people buying the stock, the price goes up, and if there are a lot of sellers, the price goes down.
Here’s the same chart but now with the volume indicator. Take a look at the big volume bars on the bottom and how they affected the stock price directly above it.
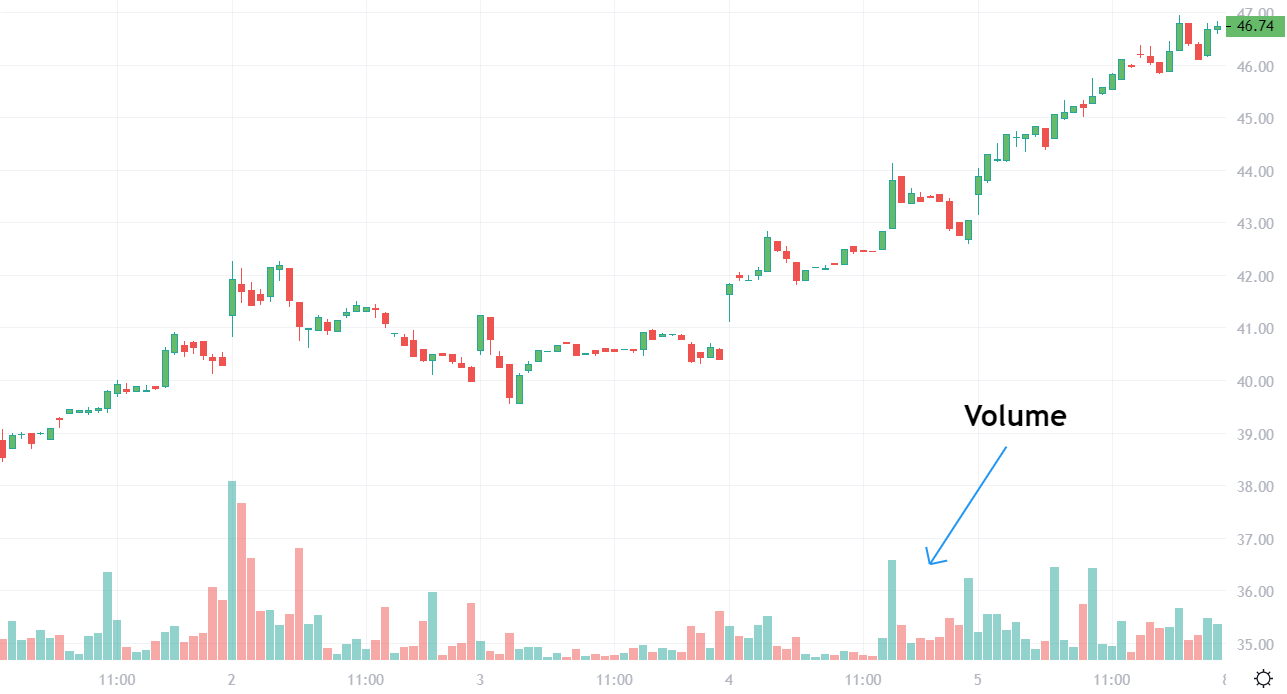
Liquidity is another term for volume; a highly-liquid stock has a lot of volume.
Support and Resistance
Now that we’ve covered candlesticks and volume (the most important aspects of a stock chart), we can begin to cover how to use them to predict where a stock price will go.
Using support and resistance is one of the most basic trading strategies there is, but it’s shockingly effective and it’s really easy to do.
Resistance is the price area where a stock has historically been shut down. It can be regarded as the temporary ceiling of a stock price, so when a stock price approaches that ceiling, one can assume that it might get rejected at the level and head back down. It represents a good place to sell your stock.
Support is the opposite - it’s the temporary floor of a stock price. If the stock price is falling, the support area will act as support (duh) for the price, preventing the price from being pushed further down. It represents a good buying opportunity because often the stock price will bounce off of the support floor and move higher.
Levels of resistance and support are created through market psychology. Traders and investors remember the key levels where a stock has been supported/rejected in the past, so they place their buy/sell orders at those levels, and the price follows.
Remember that the stock price can and will break through resistance/support, but it often takes a couple tries. When the stock price breaks through resistance and moves higher, that area of resistance turns into support. When the stock price breaks through support and moves lower, that area turns into future resistance.
Observe this chart:
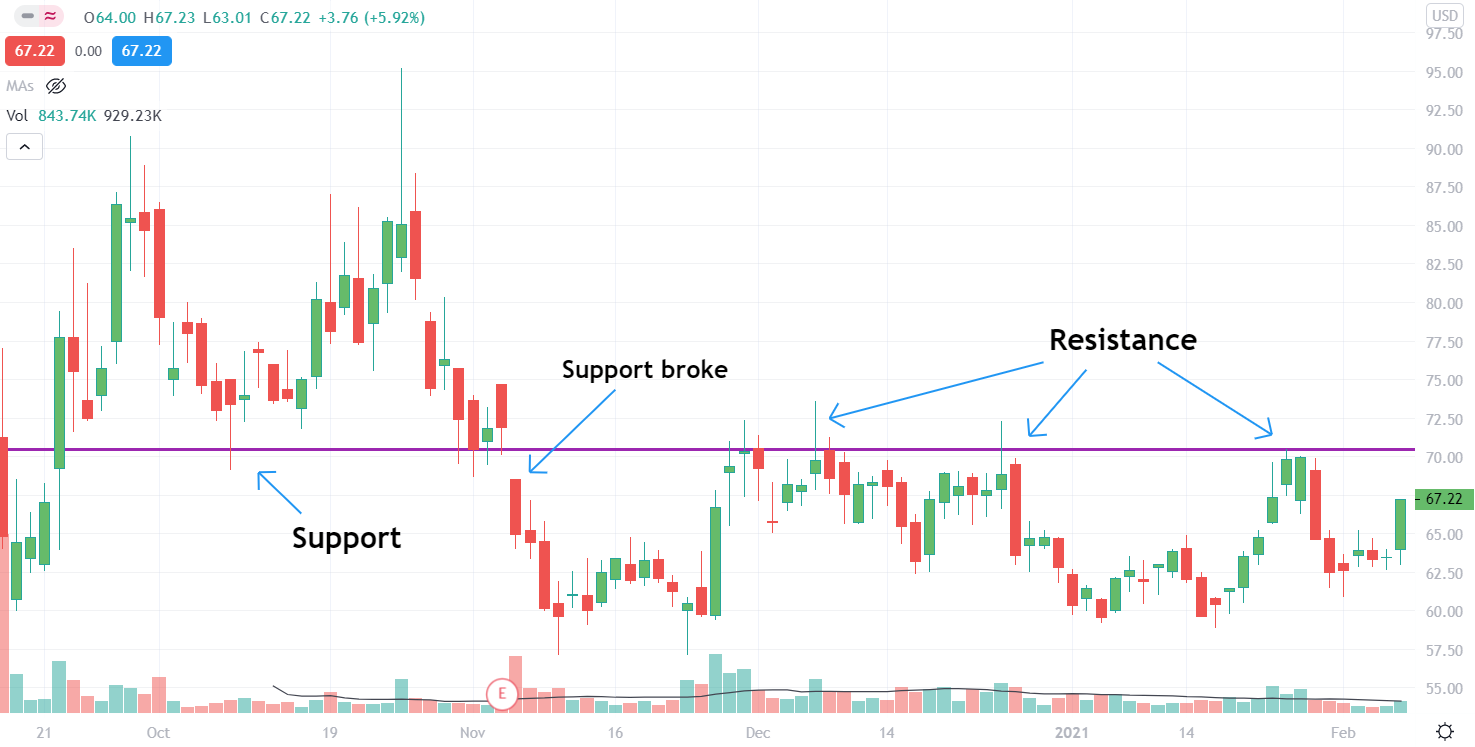
At the first noted area of support with the arrow, we are able to draw the purple line of support using the candle wick that the arrow points to and the first candle on left of the chart (it doesn’t have to be perfect). Then, notice how the price acts around that line.
Once the price breaks through the support line (with high volume), the purple line turns into resistance rather than support, and the stock gets rejected at that line several times. Note that the resistance line is holding because no candle closes above that price line. It merely has a wick that goes through it, which means that it was not strong enough to break it and close above the resistance line.
You might also notice the lower area on the chart that is also acting as support right around $58 because the price keeps bouncing off that area.
One way to trade with support and resistances is to buy at support and sell at resistance.
When the price breaks through resistance with a candle close, you could then buy the stock because it’s a good indication that the price will trade higher, as the previous resistance will now have turned into support.
Summary
Technical analysis is absolutely vital if you want to have some insight into stock price behavior, and if you’re trading stocks without it, you’re really just throwing money at the wall to see what sticks.
The topics covered in this article are important to understand because with this foundation, we can cover much more in-depth indicators and strategies that provide even more insight into making money in the stock market.
Part 2 and 3 will feature more indicators, money-making strategies, and how to get started with an account on TradingView for yourself, so be sure to subscribe and keep an eye out!
Thanks Dan! Great post